

When it comes to maintaining a globally diversified equity portfolio, relative stock market valuations should be considered when determining which areas of the market are best positioned to outperform.
As noted in ‘Why have US stocks performed so well?’ and ‘Should I own international stocks?’ the Cyclically Adjusted Price-Earnings (CAPE) Ratio is a commonly used metric in valuing stocks.
Given the strong inverse correlation between starting CAPE and long term expected returns, we find it a valuable indicator when identifying which equity markets are likely to offer the highest future return potential.
Exhibit 1 shows the relationship between relative starting valuations and the subsequent 10 year returns of Large Cap US stocks as measured by the S&P 500 vs. foreign stocks as measured by the EAFE.
Since 1983, in most periods when one market (US or foreign) was trading at a premium, the other market stock market outperformed over the subsequent 10-year period and vice versa.
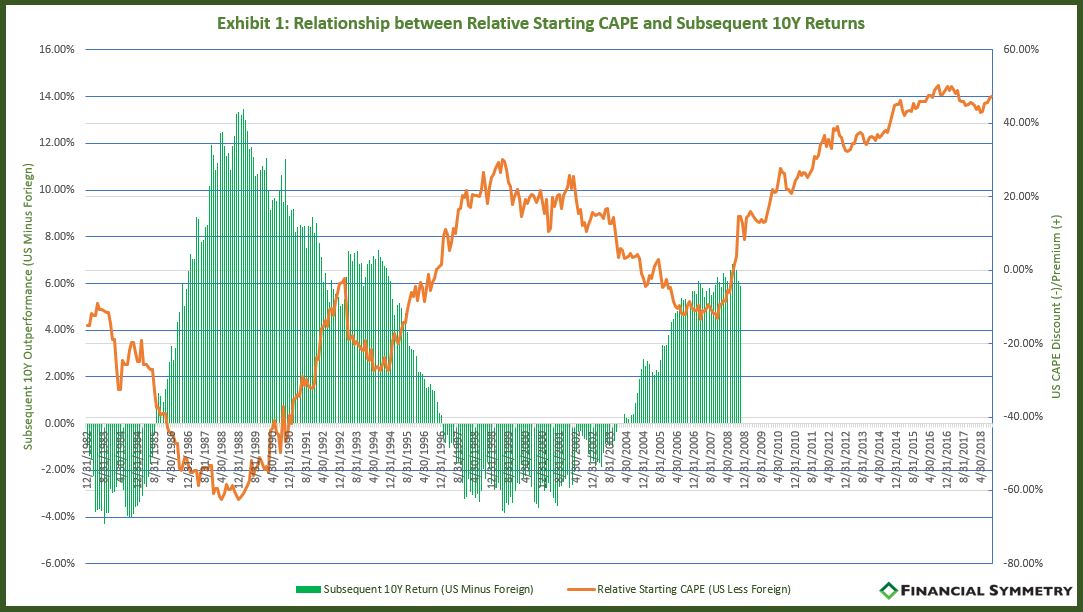
For example, in the late 1980’s foreign stocks were trading around a 40%-60% premium to US stocks. Over the next ten years US stocks returns exceed foreign stocks by over 10% annually.
On the opposite end US stocks were trading at an approx. 30% premium to foreign stocks in the late 1990’s. Over the next ten years foreign stock returns exceeded US stocks as noted in the graph below.
US stocks valuations are currently 40%-50% more expensive than foreign stocks. Based on history this would mean foreign stocks are more likely to outperform over the next ten years.
This prediction is consistent with the “experts” in our 2018 Market Outlook blog earlier this year. Greg Davis, Chief Investment Officer at Vanguard, shared his thoughts in a recent interview with CNBC stating they expect foreign markets returns to exceed US markets by 3-3.5% over the next 10 years.
Two Scenarios: EAFE Premium vs US Premium
In periods when one asset class is trading at a more extreme premium or discount, the disparity between their subsequent performance is generally greater.
Exhibit 2 shows the 10-year returns for the S&P 500 and the EAFE beginning on 5/31/1989 when foreign stocks were 57% more expensive than US stocks.
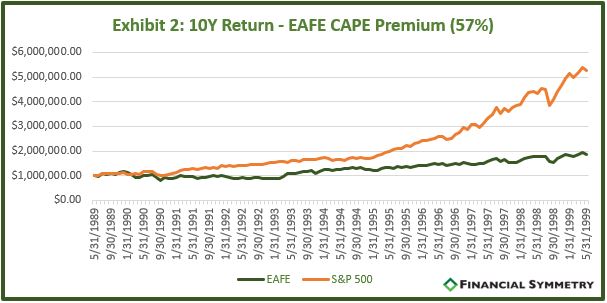
The subsequent 10-year period painted a much different picture.
While difficult to reduce exposure to areas of the market that were outperforming, as US stocks became more expensive, tilting your portfolio toward the less expensive foreign markets aided in achieving a higher rate of return.
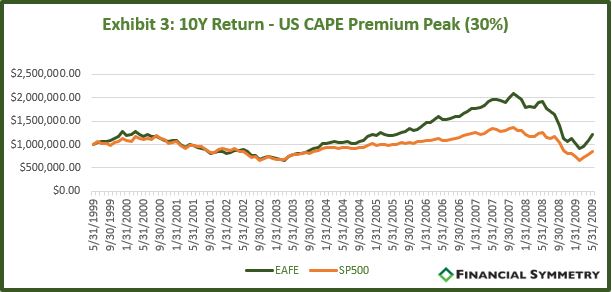
Exhibit 3 shows the 10-year returns for the S&P 500 and the EAFE beginning on 5/31/1999 when Large Cap US stocks were 30% more expensive than foreign stocks. Over the next 10 years, the EAFE outperformed the S&P500 by 3.76% on an annualized basis.
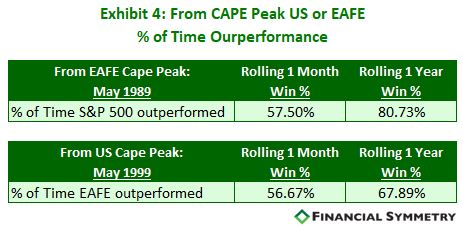
Shorter Time Periods Can’t Be Trusted
While the CAPE ratio has proven to be a sound long-term indicator, over shorter time periods performance is much more difficult to predict. Exhibit 4 shows the percentage of times the indexes outperformed their counterpart over the periods highlighted in the two charts above.
Caution: Expensive Things Can Get More Expensive
Expensive markets can continue to get more expensive, however, and relative valuations can continue to expand.
This is highlighted in recent years as US stocks have continued to outpace foreign stocks causing them to become even more richly valued. In such time periods, future expected returns for those areas of the markets decline and they become less attractive to invest in.
Taking a tactical approach to allocating your portfolio towards less expensive areas of the market can prove valuable over long periods of time, although in the short term can result in missing out on further appreciation in expensive areas of the market.
Stock markets are a complex system and there is no single ‘magic’ indicator to determine the optimal investment.
History has shown, however, that utilizing valuations can be a reliable and valuable input in determining which areas of the market are poised to have the best long-term performance while understanding that over shorter periods returns will vary.
It can prove difficult to stick with a disciplined investment strategy while seeing other areas of the market outperform, but patience is key and staying true to your strategy has proven itself time and time again.