We are in the midst of the worst crisis of confidence in our financial system since the 1930s. In a very real sense, currency is based upon trust between people, so this means that we are not trusting each other. The fault and blame is clearly not limited to any one group.
What is “subprime”?
The catalyst to the situation is the uncertainty of mortgages being repaid, as a result of mortgage lending standards that were too lenient. The vast majority of which occurred in the subprime market- which means they were not issued by Fannie and Freddie. Fannie and Freddie were certainly part of the problem as they were purchasing subprime mortgages, about 13% of the total in ’06 and ‘07.
The subprime market was not as some would say, concentrated in low income borrowers. Below is a table for 2006 subprime issues by income group, which clearly shows that the problem loans occurred across all income groups:
| Income Group | Percent of subprime loans |
| Low | 7.57% |
| Middle | 27.55% |
| Moderate | 20.99% |
| Upper | 39.37% |
.
This is obviously a mess where fingers can point in many different directions.
What are Credit Default Swaps?
A secondary problem, potentially equal in scope was the growth of the Credit Default Swaps market without any oversight. Essentially CDS’s are financial insurance. Insurance if unregulated will tend to collect too little in premiums, set aside too little in reserves, and then fail when a big event causes losses that can’t be covered.
We are now relearning a very important lesson. When it comes to debt creation and insurance, it is vital to have responsible (and ideally fairly simple) rules enforced by a government agency.
Lacking rules, market forces are so powerful that they will swing violently between bubbles and crashes.
Fortunately, we do seem to be heading in the right direction on these issues overall. However, the slow pace of addressing the problems has caused the world to question the stability of our financial system.
Part of the slowness is the result of bad timing as this is occurring close to an US election. This loss of confidence is causing a contraction in credit, and though it seems contrary to common sense, the nature of money is such that as long as productivity and population are growing, debt should be expanding or else we will have deflation- which is not a good environment for an economy.
Credit Contraction and Government Intervention
There are good and bad examples of how to address a credit contraction of this magnitude. The good examples entail a very large intervention by national governments. Norway and Sweden in the early 90s provide two of the best examples.
Essentially their governments took over much of their banking sector and put a large amount of money borrowed from their national treasuries into the banks so that the banks could get back to lending money out. They then sold the banking assets back out to the private sector once financial stability was restored. It required a large amount of money upfront but most of it was recovered through the asset sales making for a very low net cost.
Even back at the birth of our country, Alexander Hamilton understood that taking debt on at the federal treasury level is important when confidence is shaky.
Lessons from the Past
Two bad examples were the US in the 30’s and Japan in the 90’s. We think that we are not likely to repeat the 30’s as there were three major policy mistakes that we seem unlikely to make again.
- Lack of federal intervention– the attitude at the time was that the private market should always solve financial problems
- Desire to balance the federal budget– it is very unhelpful in a recession for the federal government to cut spending and raise taxes, both of which we did in the early 30’s
- Falling back on protectionism– the Smoot Hawley Tariff Act in 1930 caused retaliatory actions by other countries and contracted global trade
Japan in the 90’s failed to recognize the enormous economic toll in jobs lost and asset deflation that occurs if banks are under-capitalized, as banks must have money in order to lend out. We appear to be cognizant enough of Japan’s failure to not repeat their mistake.
What happens next?
Our thoughts…
Clearly this crisis has caused enormous losses in values of homes and investments. Since much of our job is to identify opportunities and risks, we thought you’d like to see some of our research indicating the potential for the stock market going forward.
One of our primary methods of assessing the potential risk versus the potential reward for stocks is our fair value model. The basis of the model is the growth trend of corporate America going back to the 1930’s. Assuming the current crisis does not become a deflationary accident like the 1930’s, or Japan in the 1990’s, we think the long term growth trend of our economy will remain intact.
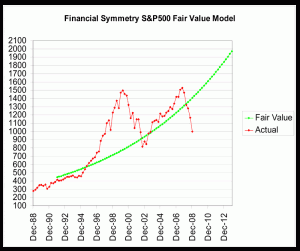
The following chart shows our estimate of fair value of the S&P500 in green. The red line shows the actual price. Notice that in early 2000, we peaked at a level far above fair value. It was in fact 48% above fair value, and we then saw a decline of close to 50%.
Notice that we are now far below fair value. The current level of 40% below fair value is lower than anytime since the 1980s.
We feel that the opportunity is just as great now as it was in the 80’s. Notice that in 2002 we also went below fair value, and from the bottom in September of 2002, stocks rose by close to 30% over the following 12 months.
Where is the Bottom?
We have been asked many times over the last few weeks where we think the bottom will be. While it is not a good strategy to try to time purchases to an expectation of a bottom in prices, taking a look at prior bear markets can be helpful in understanding the risk of more downside versus the potential for gain on the upside.
Times like these tend to make it feel as if the potential for further losses is greater than the potential for gains, however some of the best profits in bull markets tend to occur in the first third of the bull market. That means if you move out of stocks to wait until things look better, there is substantial risk of missing out on large gains. Coming out of the 2002 bear market, the market gained 46.4% during the first third of the bull market, but only 14.3% during the second third.
Headlines are the direst right around the very bottom of a bear market. For example the January 13, 1975 Business Week edition stated “The slide is steep, with no end in sight”. This was actually after the bottom had occurred in December 1974, and stock prices rose by about 40% over the following 12 months.
Since the 1950’s, the stock market has declined by more than 20% on numerous occasions. We hit the 20% decline level back in July. Of the declines since the 50’s, the average gain 12 months after a 20% decline was 16.5%. If we have a similar gain, it would translate to a gain of over 40% from now until July, 2009. Interestingly that would also take the S&P almost precisely to our model’s June 30, 2009 fair value of 1453.
The Bottom May be Near
Three measures of duration and severity point to good odds of being close to a bottom:
1) The average bear market since the 1930’s was a 33.5% decline. We have now declined by 38%.
2) The average bear market since the 1930’s lasted about 15 months, with a range of 3 months to 31 months. This one is now 12 months old.
3) The typical bear market since the 1950’s retraced about 50% of the gains from the prior bull market. This one has now retraced about 75% of the gains since 2002. So all three of these comparisons point to strong odds of being close to a bottom.
It’s important to note that the optimistic outlook depends on the current crisis not turning out to be a deflationary accident. As our stock market in the 30’s eventually declined by over 80%, and the Japanese market in the 1990’s went sideways for about ten years (their market however started at a valuation more similar to where our market was in 2000 rather than where we were at last year’s peak). We believe in both those cases, policy mistakes were the primary culprit in turning a normal recession into a deflationary accident.
As we’ve demonstrated with the above analysis, we believe the odds are heavily in favor of gains for stocks over the next 1 to 3 years, so we are maintaining a bullish stance.
Your Personal Situation
Your personal asset allocation range is based on your risk capacity, which is primarily dependent on your expected cash flows to or from your investments.
If you feel that your situation has changed in a way that will cause you to withdraw more heavily from your investments, your risk capacity may be diminished.
If you think you’ll be able to add more to your investments, your capacity may actually be higher. In either of those cases, please let us know so we can see if any further adjustments are warranted.


