It’s probably not news to most value investors that the value premium has struggled over the past decade. What might be news is just how extreme an outlier recent value stock underperformance represents.
The periodic returns for value versus growth in Exhibit 1 convey a stark contrast between recent years and the longer run of evidence, suggesting the past decade’s disappointing premium was disproportionally impacted by the last three years. Over the first seven years of the last decade (July 2010–June 2017), value stocks actually outperformed their prior long-run average return, 14.3% versus 12.8%. However, a substantially stronger-than-average performance from growth stocks (16.6% versus 9.0%) resulted in a negative value premium for this period.
The last three years were a different story. While growth continued to its historically high return, value stocks produced a return of –3.30%, resulting in an annualized value premium of –21.22% over this period.

This three-year run warrants further inspection—just how uncommon was this value premium magnitude? Literally unprecedented, as illustrated by the rolling three-year value premiums in Exhibit 2. Of the 1,093 rolling observations in US history, the three years ending in June 2020 ranked dead last. This is the very definition of an outlier.
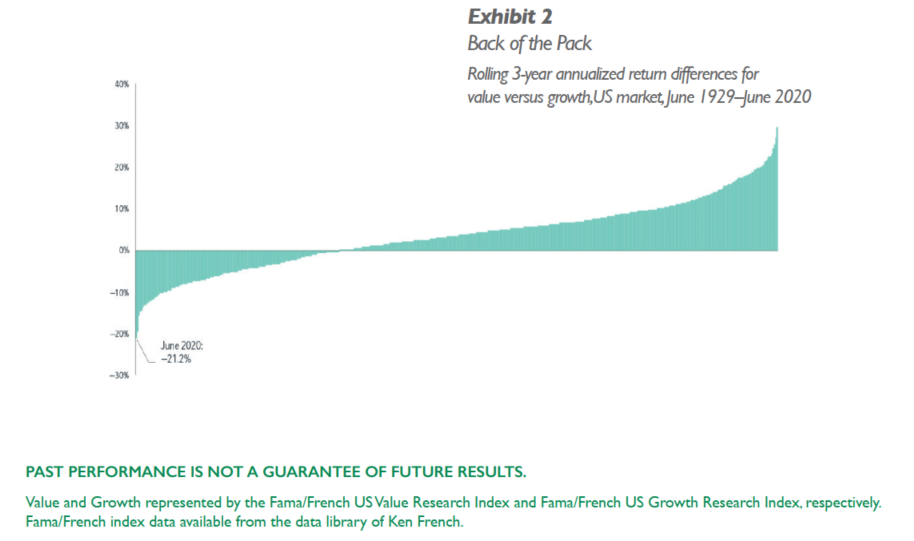
Appreciating the extraordinary nature of an observation is important to assessing its implications going forward. A successful entrepreneur becoming a billionaire after dropping out of college does not marginalize higher education as a means to maximizing one’s career earnings potential. Similarly, asset allocation decisions are more reliably informed by a long series of evidence rather than the exception. An extremely disappointing run of results for value versus growth does not necessarily signal a “new normal” for value. The theoretical premise behind value investing—paying a lower price for expected future cash ?ows, indicating higher expected returns—is just as valid today as it was 10 years ago. And even strongly negative recent value premiums haven’t offset a preponderance of evidence for positive value premiums spanning nearly a century in the US and more than five decades in non-US markets.
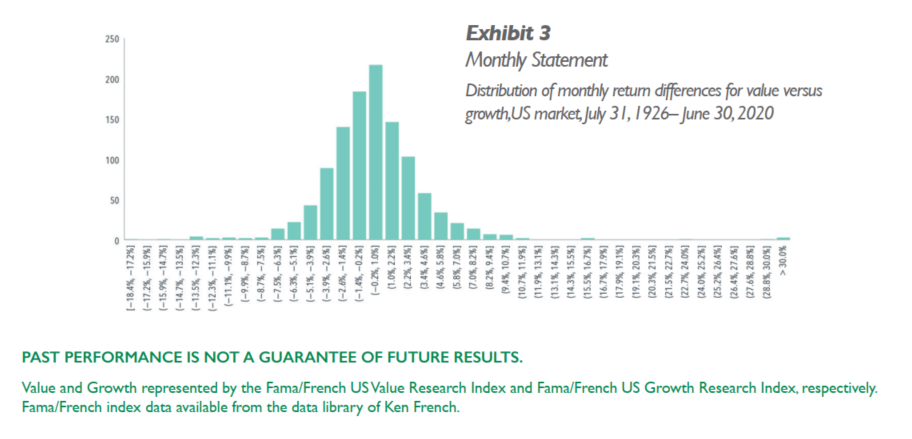
While exceptional observations of the value premium should not erode a belief in value investing, they do serve as a reminder of the variability of realized returns. As Exhibit 3 illustrates, there has been a wide range of outcomes for the premium on a month-to month basis. In fact, the distribution tells us that when value shows up, it can show up in bunches. For example, about 1 in 20 months during this period saw a realized value premium of at least 6%, or 20 times the size of the average monthly premium (0.30%).
Why is this important for investors (and value strategy managers)? These outsize positive returns are an important component of the long-run positive average value premium. A disciplined focus on value is essential to capturing this source of higher expected returns.
INDEX DESCRIPTIONS
Fama/French US Value Research Index: Provided by Fama/French from CRSP securities data. Includes the lower 30% in price-to-book of NYSE securities (plus NYSE Amex equivalents since July 1962 and Nasdaq equivalents since 1973). Fama/French US Growth Research Index: Provided by Fama/French from CRSP securities data. Includes the higher 30% in price-to-book of NYSE securities (plus NYSE Amex equivalents since July 1962 and Nasdaq equivalents since 1973).
The Dimensional and Fama/French Indices re?ected above are not “financial indices” for the purpose of the EU Markets in Financial Instruments Directive (MiFID). Rather, they represent academic concepts that may be relevant or informative about portfolio construction and are not available for direct investment or for use as a benchmark. Their performance does not re?ect the expenses associated with the management of an actual portfolio. Index returns are not representative of actual portfolios and do not re?ect costs and fees associated with an actual investment. Actual returns may be lower. See the appendix for descriptions of the Dimensional and Fama/French indexes.
Source: Dimensional.com, Dimensional Fund Advisors LP is an investment advisor registered with the Securities and Exchange Commission.